DRS windows and GUI components
This section will give a general overview over the DRS main application window, the different areas of its graphical user interface and their functions.
The main application window is split into different areas which give access to its functions:
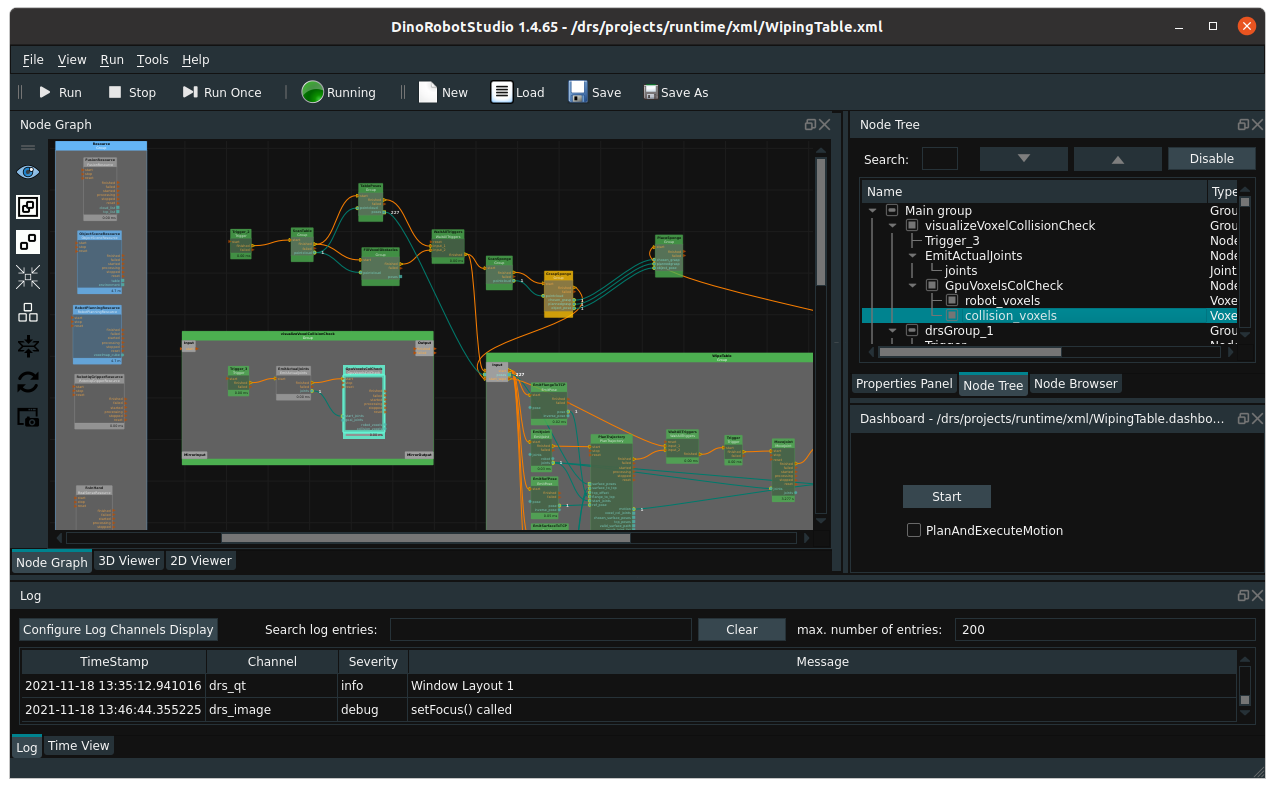
Complete DRS main window, this shows a collection of different views and windows that will be described below.
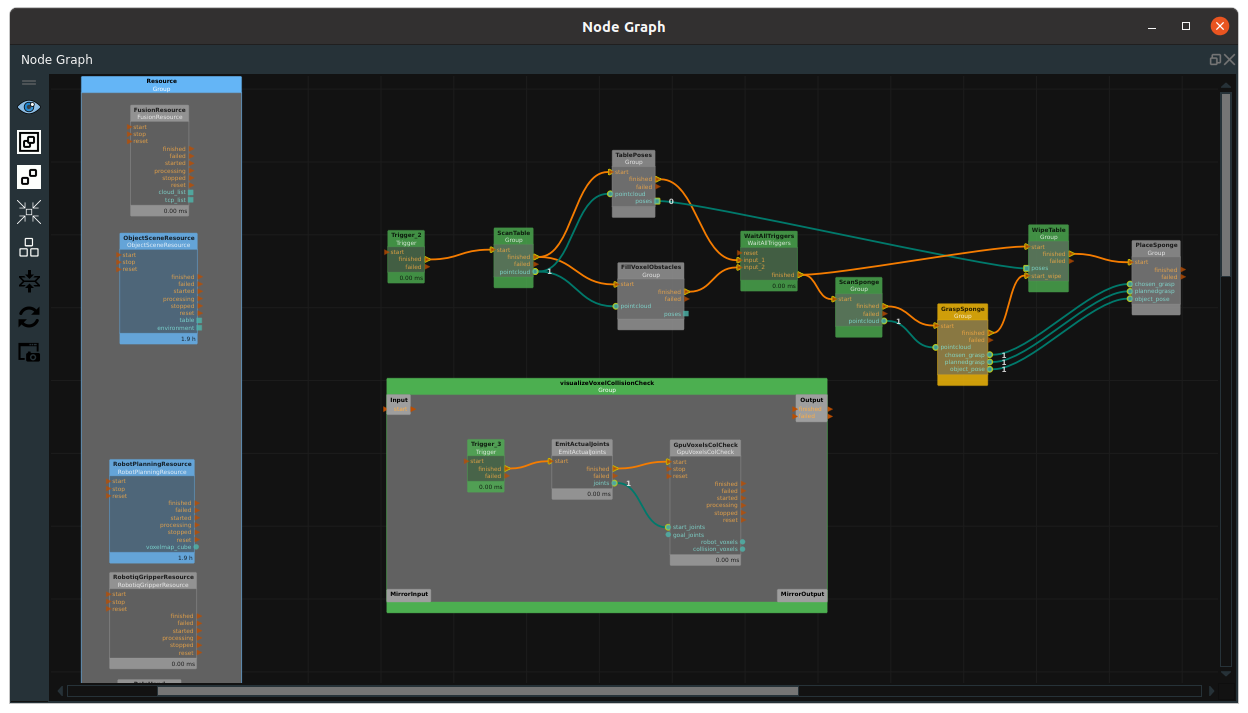
Node graph
The Node Graph is the main part of the graphical programming interface, it is where the automation application is build using nodes connected by edges. A node is a small processing unit that only executes a single function. These functions can be small (example: take an image) or more complicated (plan a collision free robot movement in an obstacle filled working room). All nodes have their own inputs, outputs and parameters. The default node setup has event inputs to start a node, data inputs to feed in needed input data, parameters to configure its processing details and outputs for data results and to trigger the next node in the program.
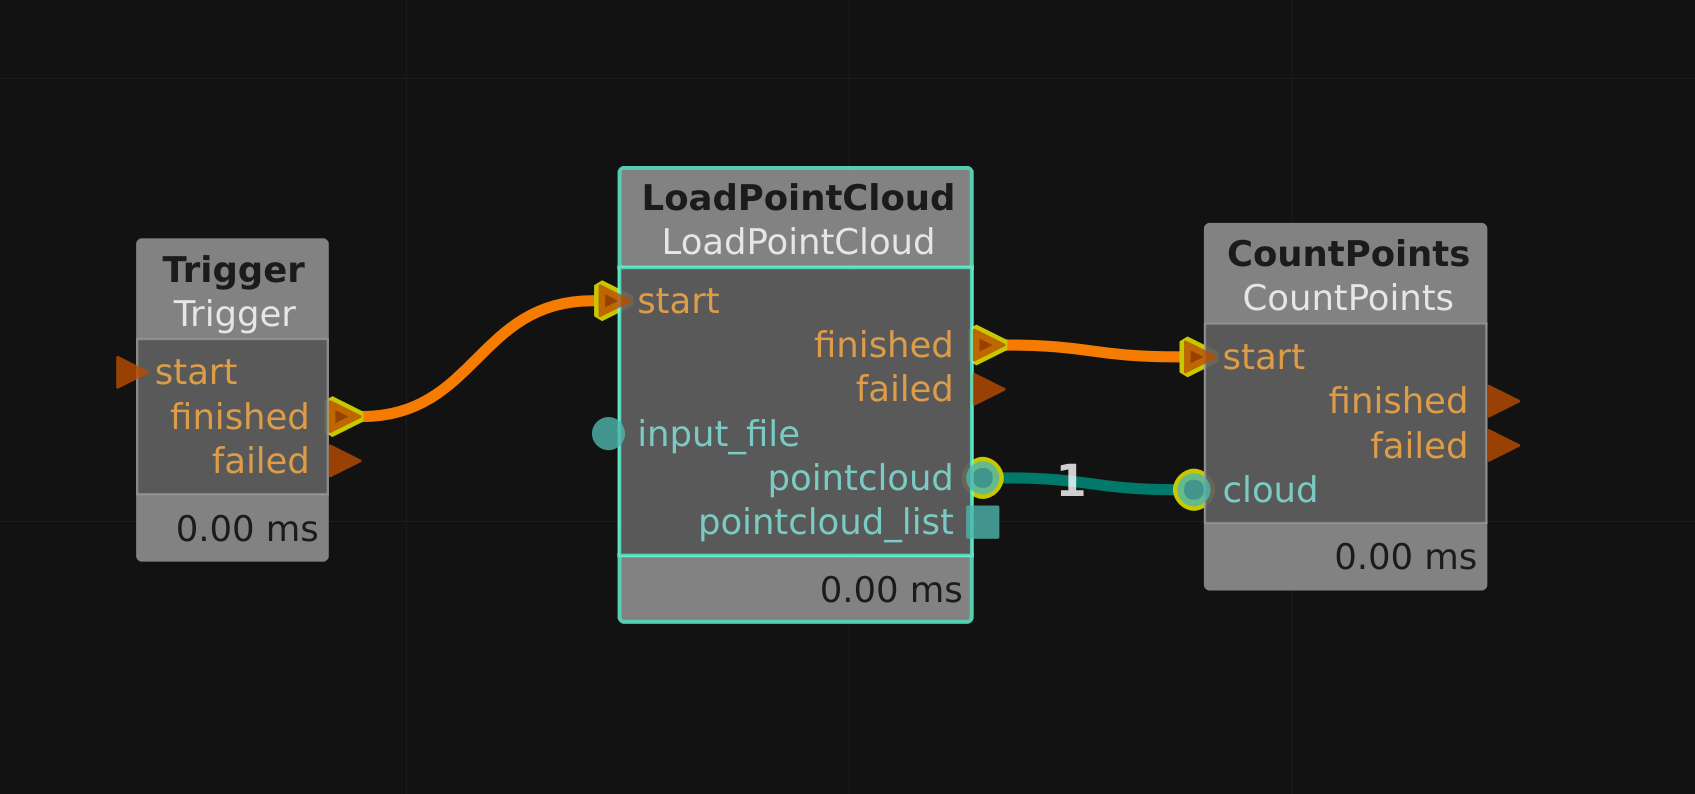
Three nodes connected with edges that transport events and data.
After running its embedded function a node has a result state and result data, which can be connected to other nodes and used in the following nodes in the graph.
Nodes are connected together using edges which connect nodey by their ports. These edges transport events or data. A single nodes function is run when it receives an event on its ‘start’ event input port, after the node finishes the work it sends an event out on its ‘finished’ (or ‘failed’, depending on the nodes result state) port.
Nodes can be chosen from a catalog of already prepared nodes, more about which topics and functions our nodes cover can be found in the section on the next pages.
Special nodes ‘Resources’ serve as hardware abstractions (for example: robot arms) and interface to their (real or simulated) hardware counterparts. After setting up a resource node and configuring it with needed details (for example: IP address to connect to the real robots command interface; or: camera sensor settings like resolution or exposure time) it can be used later by function nodes that move the robot arm or take an image using the camera.
To aid in program overview and functionality reuse of parts of the node graph: multiple nodes and their edge connections can be grouped together.
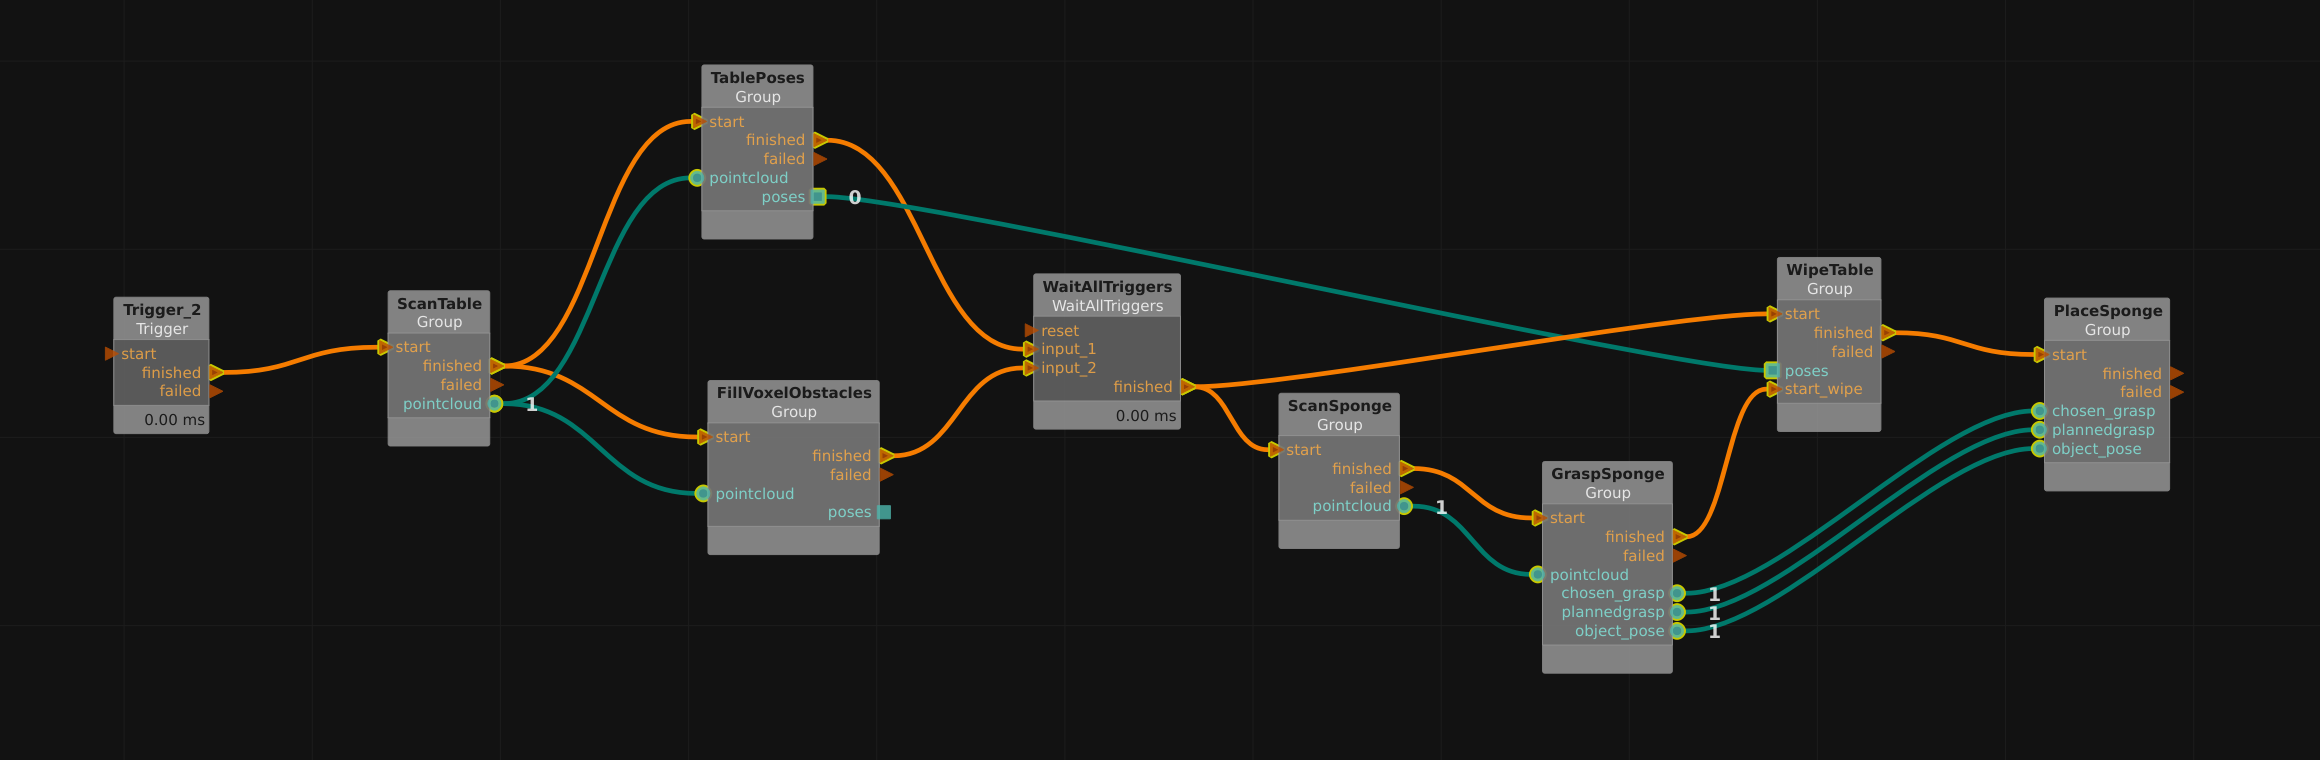
Groups contain related nodes and are used to structure a program into smaller sections. This helps to keep the overview in large programs.
Nodes and groups are displayed color coded to show their status, so the users attention can be guided to problematic situations.
The node graph can be loaded from the computers disk and edited in this window, it can be run or saved back to disk (all together or split into groups).
Color coding nodes and groups is used to display their state.
3D View
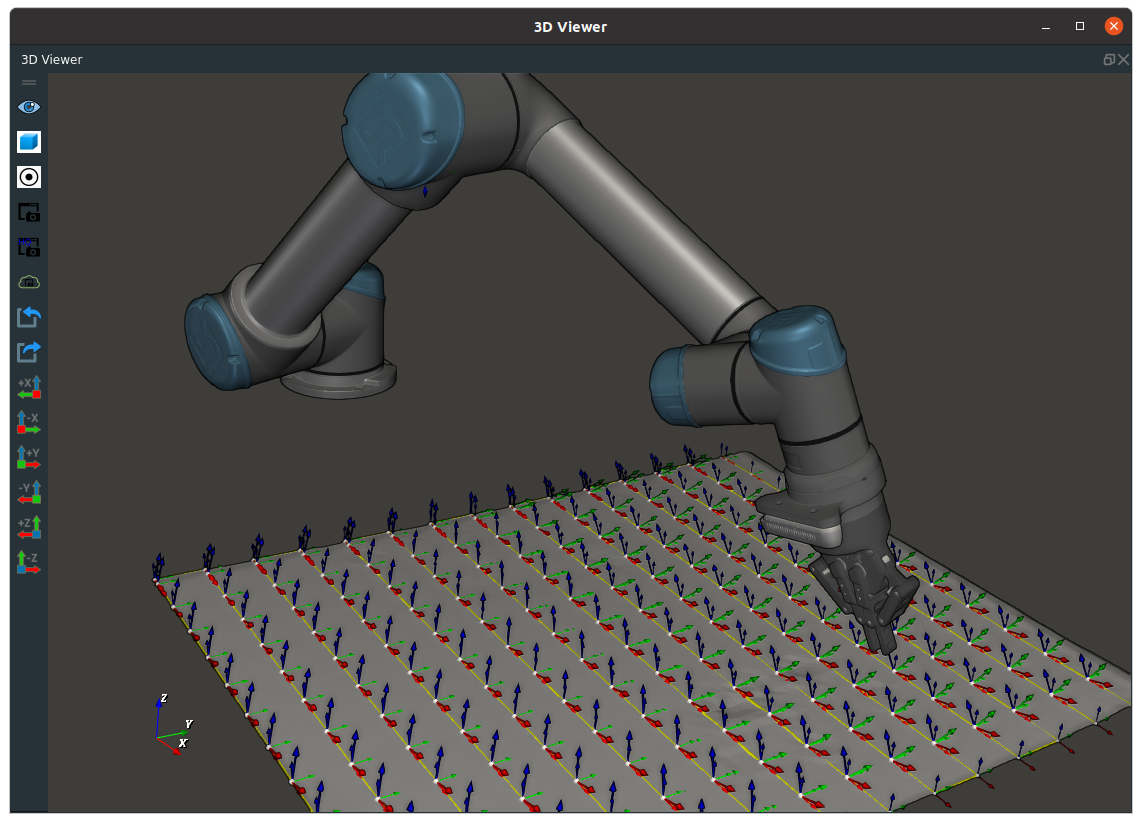
3D View showing an Universal Robots arm with an Robotiq gripper and an Intel RealSense depth camera mounted on the arm. Visible in the lower part of the image: a grey surface with a planned surface path (yellow line) that connects surface poses (the little 3 arrow coordinate systems). The left window bar holds buttons to access functions to control the view or take screenshots.
This window shows a generated view of the 3D workspace. It can show animated hardware models (for example: the current position of the robot arm), objects, sensor data, poses, position markers and robot motion paths. It is updated while the program is running and displays a live view of the current state of the models and objects.
It is used to visualize the current state of the important objects and the environment for the robot application. Additionally these objects can be manually moved, for example for trying out a good robot mounting position so that the object and work positions are reachable by the arm. The camera position and visualization settings can be set by the user.
2D View
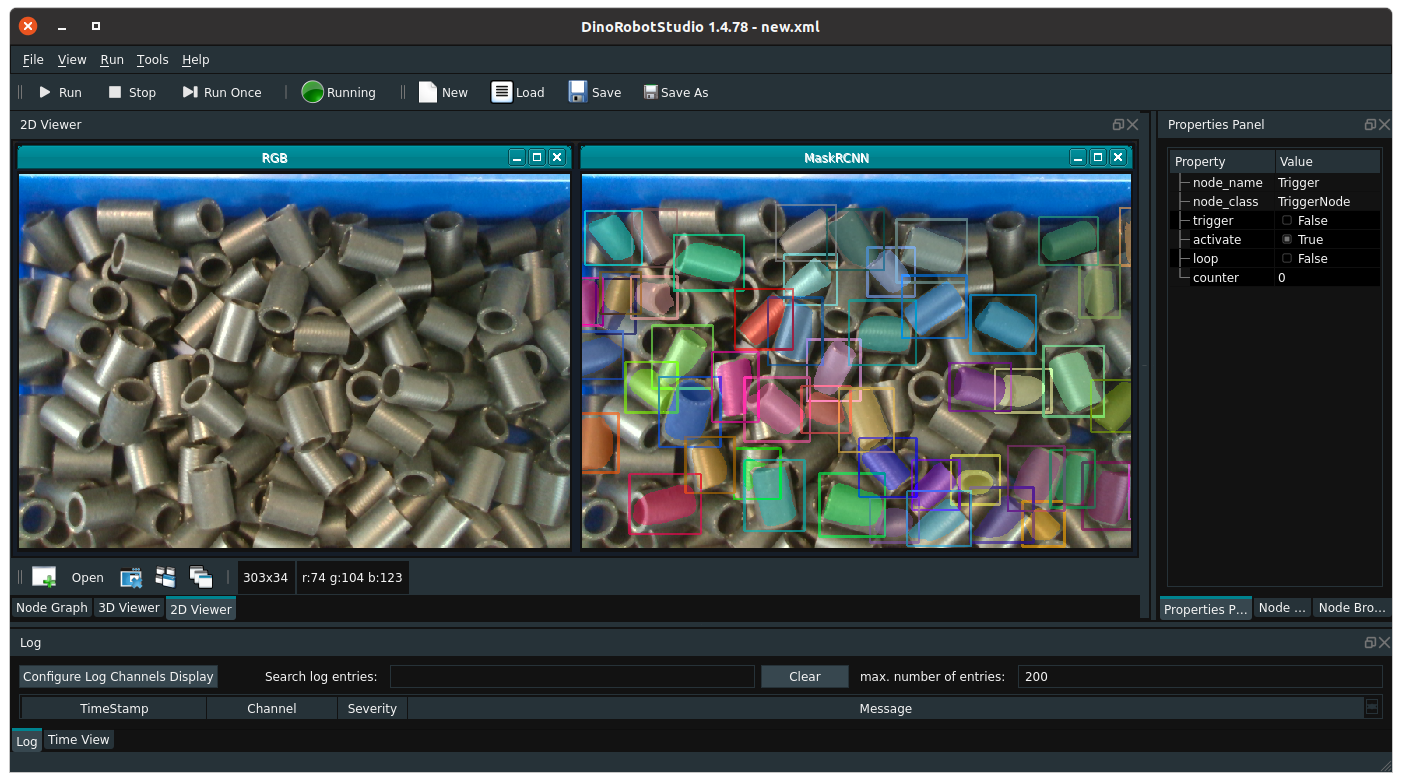
2D images (captured from cameras, loaded from disk or from previous processing steps) are shown in the 2D view. The icons on the window border give access to functions to order the single images.
The 2D view allows displaying images that were taken from cameras or from their processing steps. It allows control and visual inspection of the results of the image processing steps.
Robot Panel
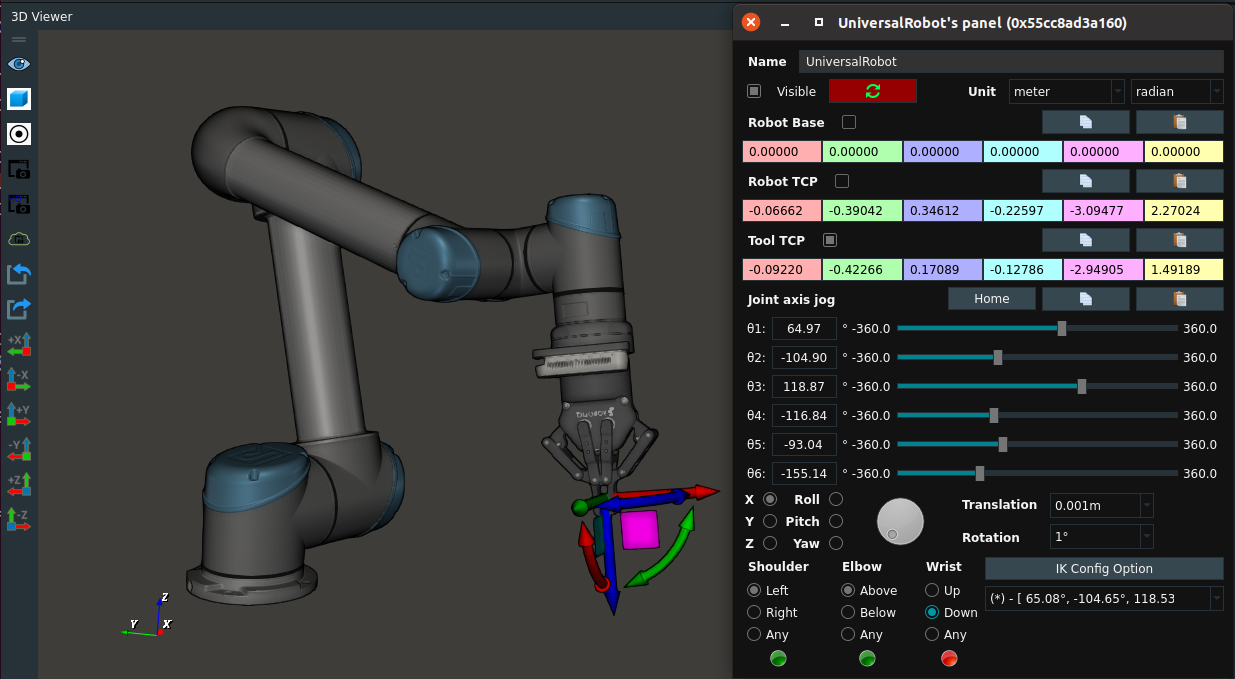
Robot Panel (on the right side of this screenshot) of an Universal Robot arm in use. The three colored number lines display the current poses of the robots base, its TCP and the Tool TCP. The sliders and numerical displays below that show the 6 joint angles. The tools and switches below that allow a user to position the arm and set parameters for the inverse kinematics solver.
The Robot Panel displays the current state of a robot arm. Its current joint angles or positions of the base or the current tool position are displayed as numerical values to allow copy & paste operations, the joints can be individually moved using sliders or by entering new angle values.
Properties Panel
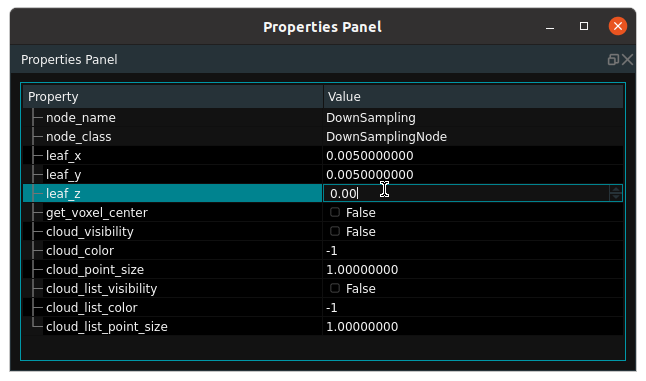
This Properties Panel shows the available properties of a DownSampling node. In this example the parameters are strings, numbers and checkboxes, changing these parameters change the output and alow to setup the pointcloud downsamping to the applications needs.
The properties panel is the location where the parameters of a node from the node graph can be viewed and changed. All parameters for a single node or group are displayed in a list and are changeable. Special support for grouped parameter types like poses or for filenames exists.
Node Browser
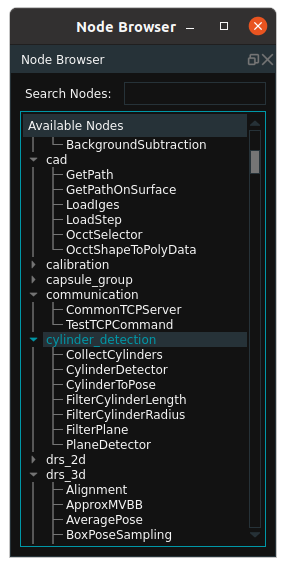
Node browser showing all available nodes of DRS sorted in their sections, these sections can be 'folded' to hide their contents.
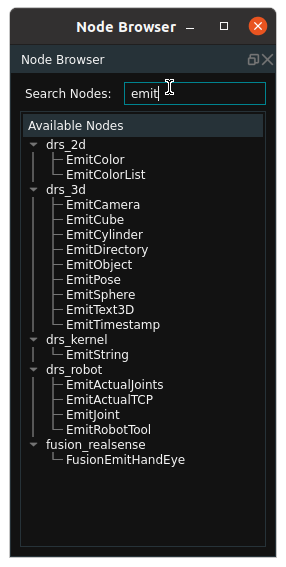
Here the searchbox on top of the window is used to search for all nodes which name contain the string 'emit'.
The node browser shows a searchable list of all available node types. It allows selecting a node type to be created and added to the node graph by ‘dragging out’ the node name and dropping it in the node graph window. It shows all available nodes from the base DRS installation and in addition from all installed DRS plugins.
Node Tree
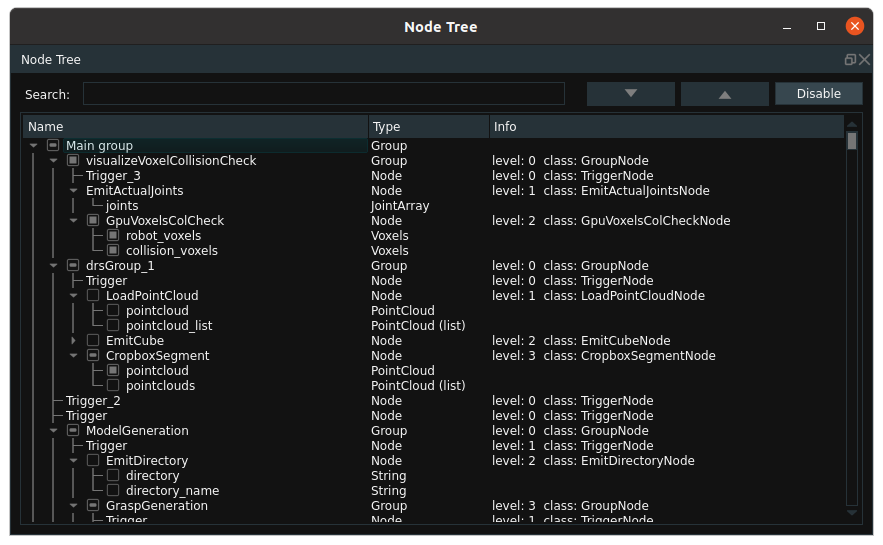
This Node Tree Window displays the TableWipe program in textual form. For each node their group and position in the program is shown, including the node type and the node data outputs.
The node tree is a textual representation of the whole applications node graph. It allows text searches over all nodes, their given names and their parameters. It shows the different groups of the node graph as different levels in a tree structure. An entry from the node tree can be easily highlighted in the node graph itself.
Dashboard
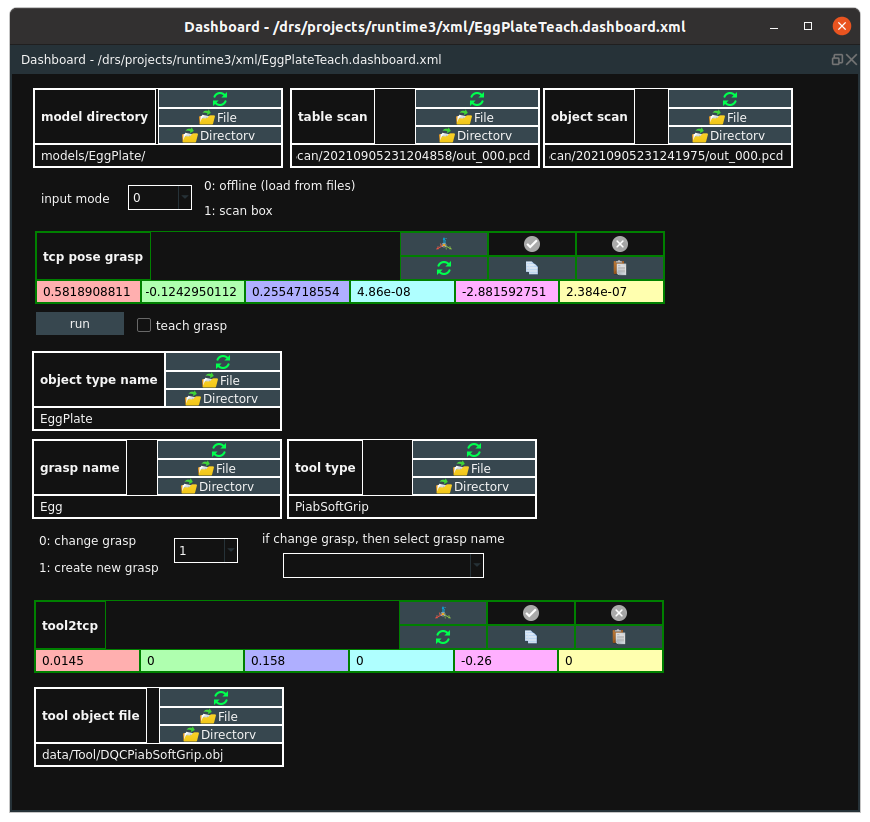
This dashboard was built as a user interface to configure a program to grasp eggs and place them in their egg carton. holds a collection of widgets. Some widgets are used to setup file paths for models or 3D scans, some give access to poses or set options using checkboxes or dropdown menus. Buttons allow triggering the program execution.
In the dashboard an application specific user interface can be build. Using input and output widgets the user is able to connect them and their values to the program to control an application. There are input widgets (buttons, text fields, chooser boxes) and output widgets (text and numerical displays). These widgets are connected to node parameters and control or display their values or events. Each application (each node graph) can bring its own user interface to the dashboard.
Log View
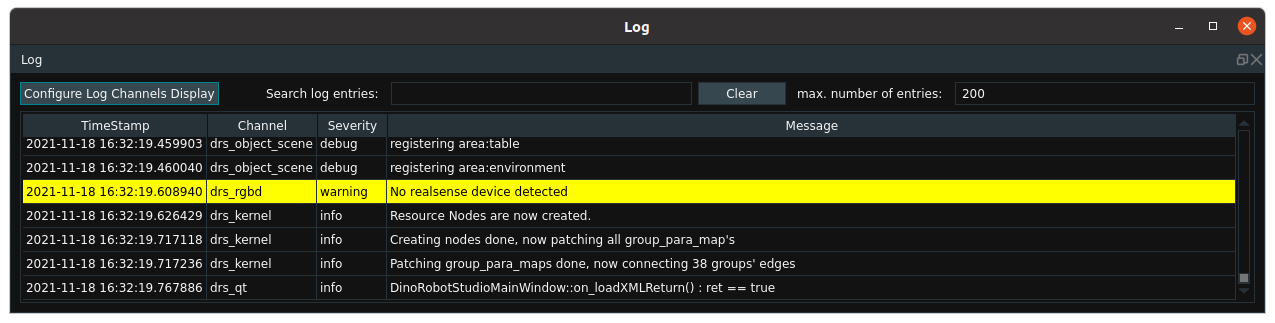
This Log View shows messages from the program execution, each entry has its own timestamp, its channel and severity. The log shows warnings (here the yellow line of text) and errors color-coded.)
The log view displays a log of events (from the user or the application) in a textual table. Log entries have a timestamp, a log channel and a severity marker and can be selected to be displayed or searched for broader or specific information needs. The log allows deep inspection of the applications internals and their timed sequence of occurance.
Time View
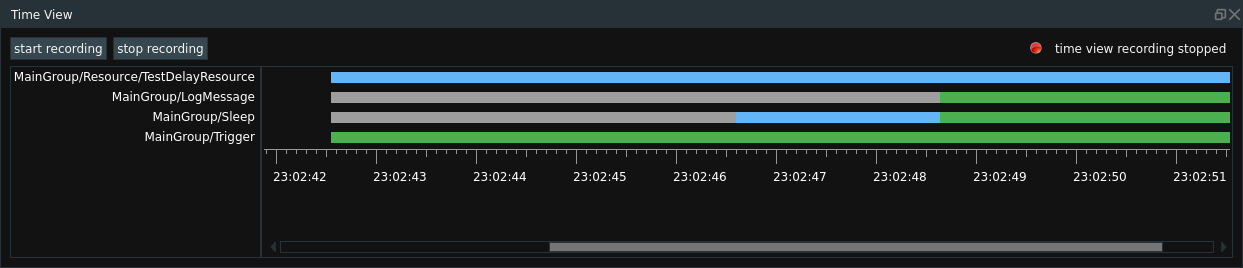
The Timeview is able to record and display the state of previous selected nodes or groups.
The time view window allows the creation and visualization of timing graphs of node or group status in a running application.
Main Application Window
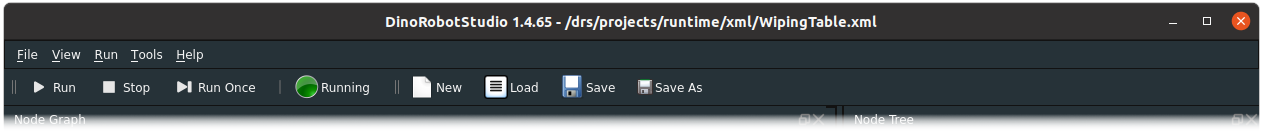
The top of the Main Application Window holds the textual main menu and Icons to access DRS main functions. These allow to start and stop the main processing loop and view its status or create new, load and save automation programs.
The main DRS application window holds all the single windows from above and has some additional capabilities:
It holds the main DRS menu for file operations, loop control and additional tools. It allows a node graph to be started (only once or to keep it running in a continuous loop) or stopped again. The different GUI windows can be arranged in different layouts or configurations according to the users wishes. Log files can and often are written to the disk for later analysis.
Runtime Directory
The runtime directory is the place where a DRS installation holds all its assets like the different robot setups (models and kinematic files for robots of different manufacturers), object files, saved whole node graphs and exported groups. It is also used as the working directory to hold recorded sensor data (images, raw data, pointclouds), calibration files, object model files and results of data processing steps (if they are saved by the application).